Project 4: Portfolio Company Performance Dashboard (Power BI)
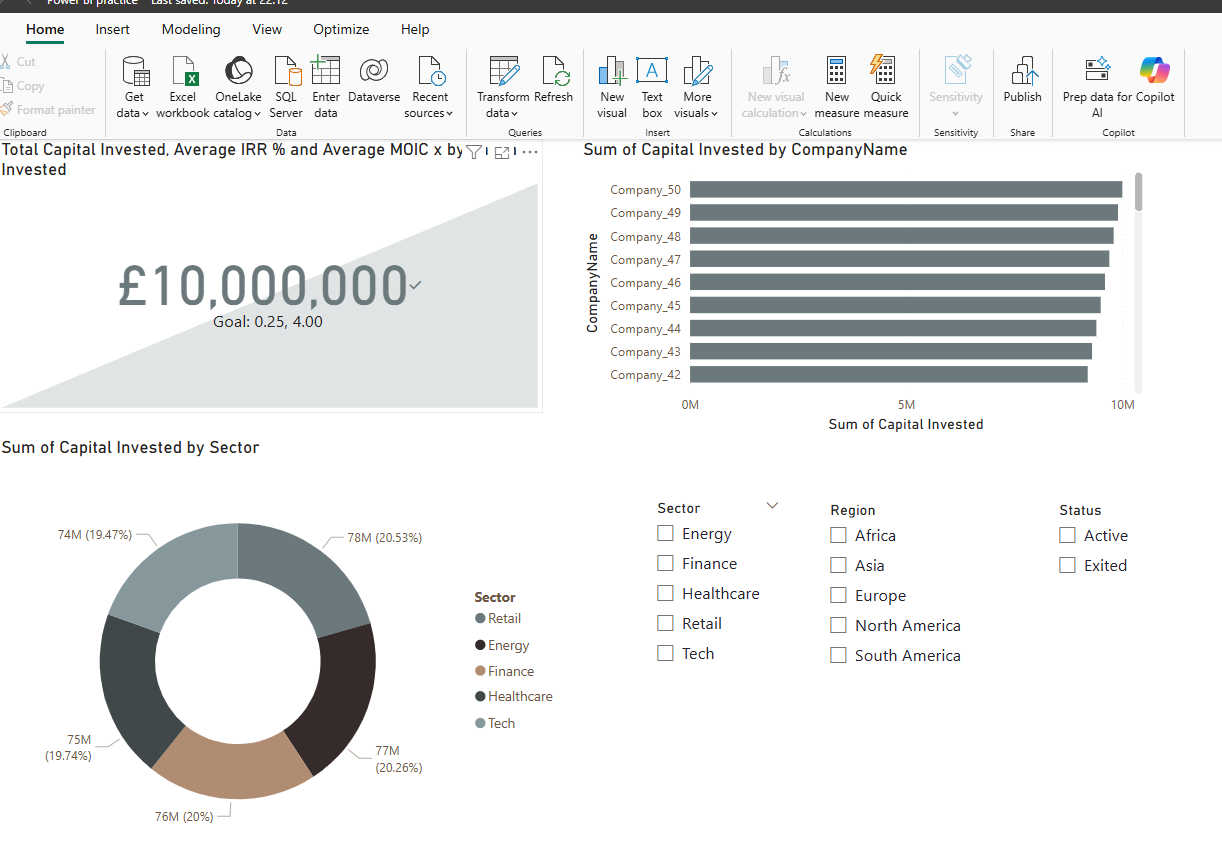
This hands-on discovery project showcases a Private Equity (PE) Portfolio Performance Dashboard, built in Power BI. It visualises financial and investment KPIs for a portfolio of 50 companies, designed to reflect real-world reporting needs in the private equity sector. 🔗 View Project file here 🛠 Tools: Power BI Desktop, DAX, data modeling Description: I independently: Modelled investment and financial data across multiple related tables. Created DAX measures to calculate key metrics such as IRR, MOIC, EBITDA Margin, and Revenue Growth. Built a clean, neutral-themed dashboard featuring: Performance trends over time Sector distribution with slicers Company-level financial insights and KPIs Applied best practices in Power BI, including data modelling, cross-filtering, slicers, KPI cards, conditional formatting, and interactive visuals. This project demonstrates my ability to build insightful dashboards from scratch, apply financial logic, and align visuals with the analytical priorities of finance and investment teams.